
The Urban Heat Problem
Urban heat islands contribute to an estimated 489,000 heat-related deaths annually — a number rising with climate change and urban densification. The satellite data needed to locate heat-vulnerable neighborhoods at block-level resolution has existed in ESA's Copernicus archive since 2015: high-resolution thermal imagery refreshed every five days.
The barrier is format. Raw Sentinel-2 output is GeoTIFF files with spectral band values requiring specialist GIS software and remote sensing expertise to interpret. Urban planners and public health teams who could act on this data rarely can. HeatShield.ai is the processing layer between the archive and the people making decisions.
The Data Pipeline
The pipeline starts with a Copernicus Hub API pull of Sentinel-2 Band 10 (SWIR-1) and Band 11 (SWIR-2). A Python FastAPI service applies the Jiménez-Muñoz split-window algorithm to derive land surface temperature — the split-window step corrects for atmospheric water vapor emissivity, which is non-optional: uncorrected Band 10/11 values map spectral interference, not surface heat.
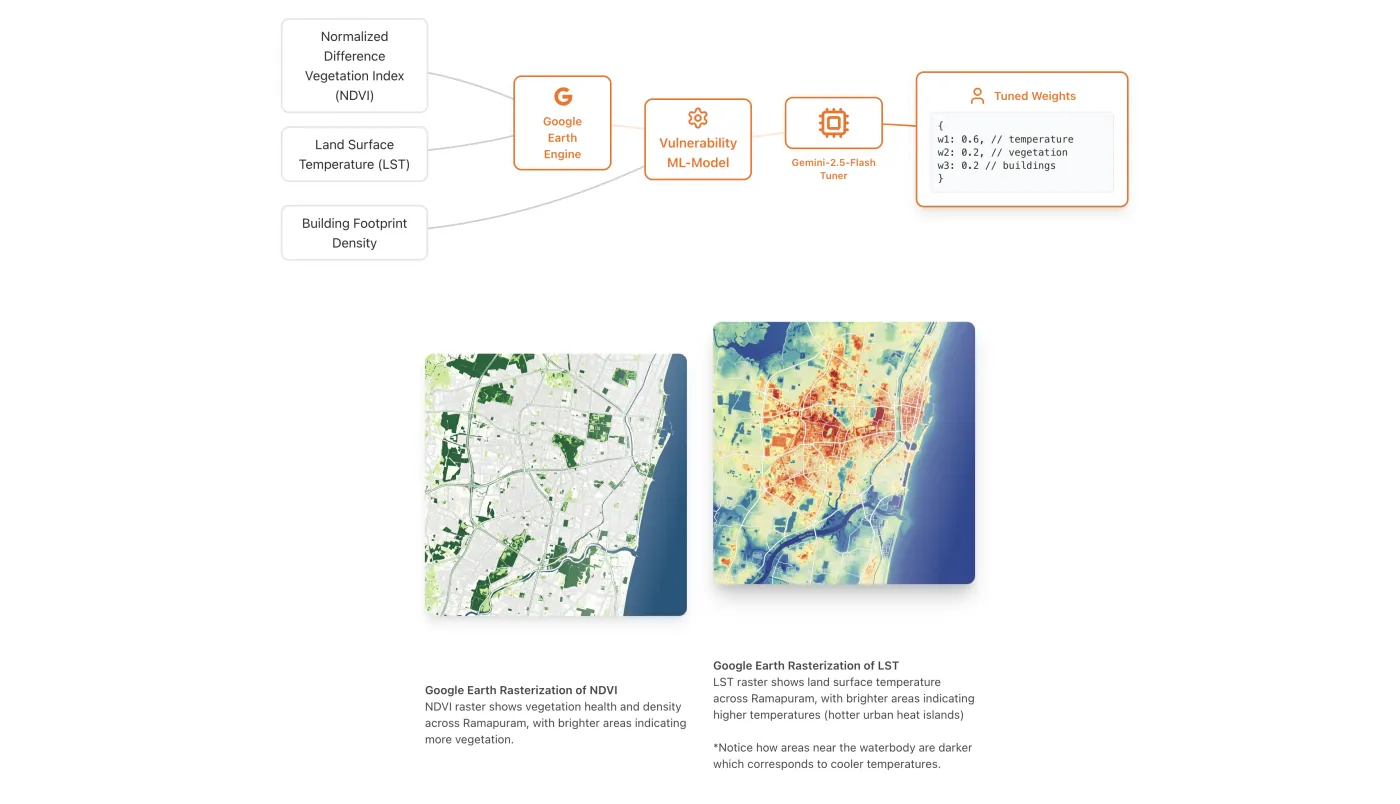
ML pipeline: NDVI, LST, and building footprint density fed into the vulnerability model via Google Earth Engine, with Gemini-tuned weights.
Surface Classification
A Hugging Face semantic segmentation model classifies each pixel's surface material — asphalt, vegetation, water, rooftop — and assigns a heat-retention coefficient based on emissivity properties. High-density impervious surface scores higher than vegetated cover. The composite vulnerability score weights LST, surface retention coefficient, and census-level population density into a single value per grid cell.
3D Visualization
Processed GeoJSON is served from a Dockerized FastAPI instance to a Next.js frontend where Deck.gl's HexagonLayer encodes vulnerability as 3D column height over a Mapbox GL base. Height represents intensity — neighborhoods that look identical on a 2D map separate clearly when height encodes heat. Clicking any location surfaces its vulnerability breakdown and triggers an AI-generated heat mitigation plan.
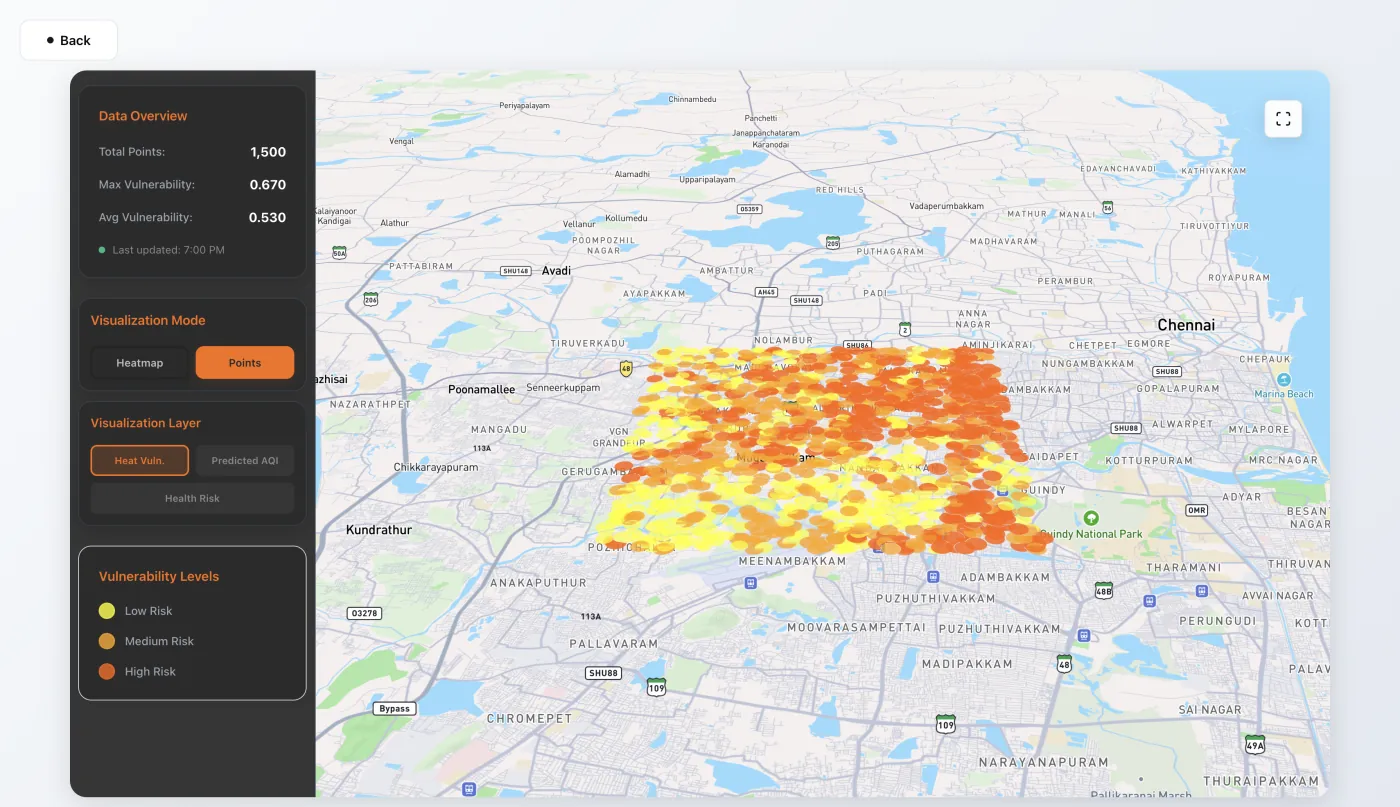
Live vulnerability heatmap over Chennai — 1,500 data points, max vulnerability 0.670, colour-coded by risk tier.
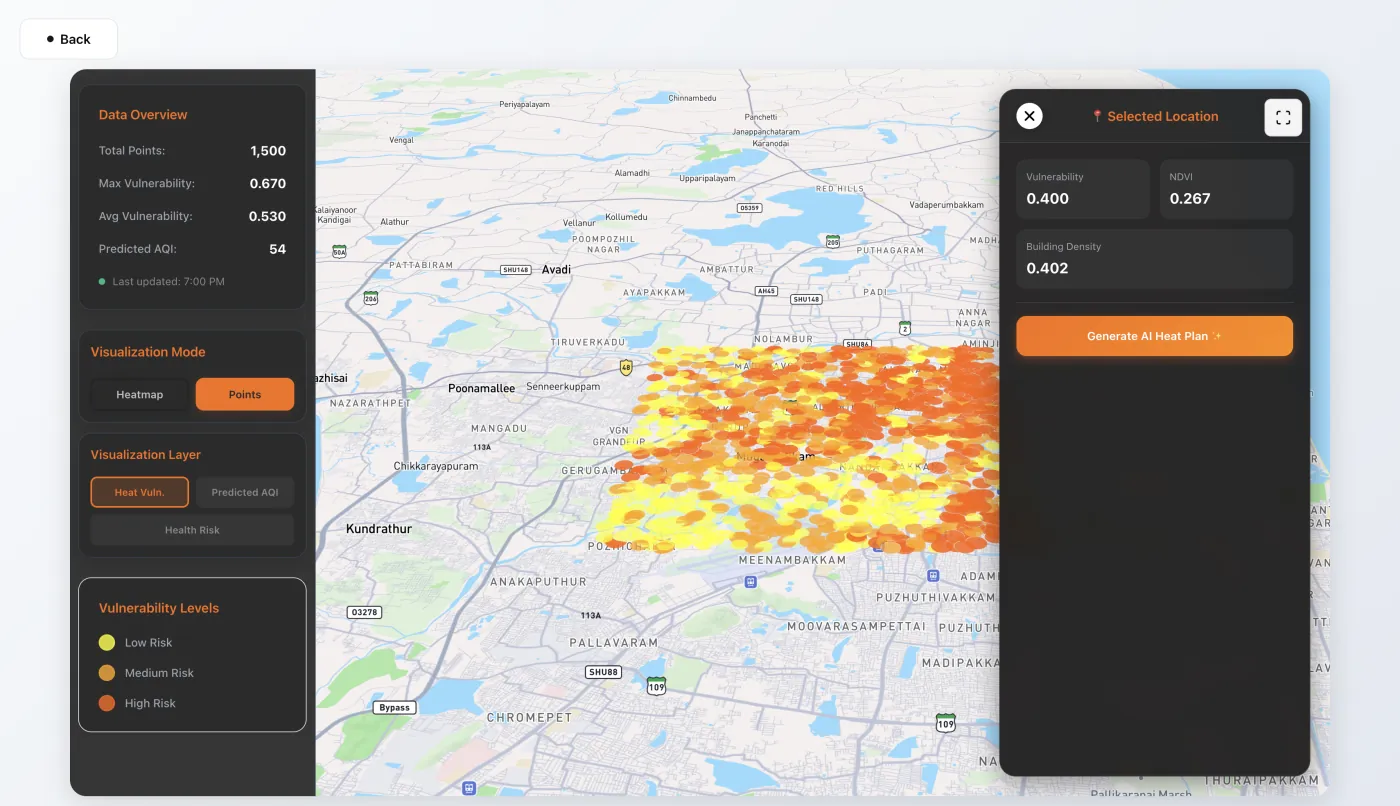
Location drill-down panel: per-point vulnerability, NDVI, and building density scores with one-click AI heat plan generation.
Pipeline Flow
- —Copernicus Hub API → Sentinel-2 Band 10/11 pull
- —Jiménez-Muñoz split-window → land surface temperature with atmospheric correction
- —HuggingFace semantic segmentation → per-pixel surface heat-retention coefficient
- —Composite score: LST × surface emissivity × population density → GeoJSON
- —Deck.gl HexagonLayer over Mapbox GL → 3D height-encoded vulnerability map
What's Next
HeatShield.ai is live. The domain overhead was significant — emissivity theory, split-window physics, the physical distinction between surface and air temperature are load-bearing for output correctness. A map that looks authoritative but uses uncorrected spectral values is actively misleading. Planned extensions include NDVI-based vegetation density scoring and seasonal time-series comparison to track block-level heat change year over year.